
Short-Term Outlook for U.S. Dollar
The U.S. dollar is worth watching closely. If it witnesses wild swings, assets across the board get impacted. So, ignoring what’s happening with the dollar could be a big mistake.
In the short term, there are a few developments that investors shouldn’t ignore. They are saying that the U.S. dollar could drop.
Advertisement

Look at the chart below. It plots the U.S. dollar index, which tracks the performance of the dollar relative to other major currencies. It gives us a good picture of how the greenback is doing.
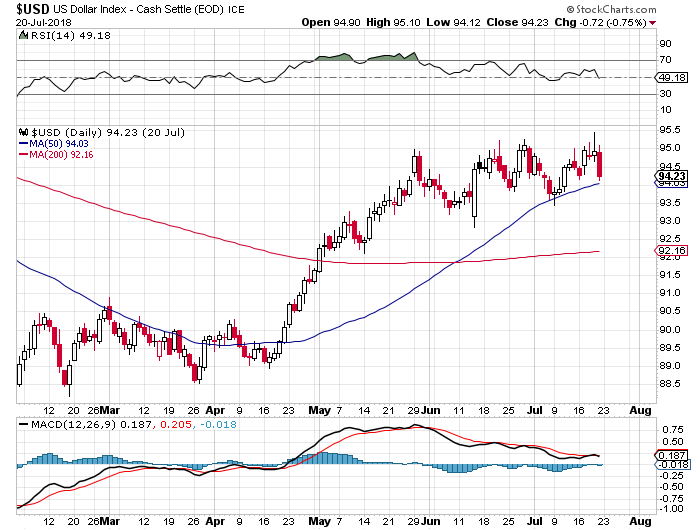
Chart courtesy of StockCharts.com
The 95.00 level in the U.S. dollar index has been a very interesting one over the past few months. The dollar hasn’t been able to break above it, although the level has been tested six times in late May.
As this is has been happening, we have been seeing momentum indicators like the moving average convergence/divergence (MACD)—plotted at the bottom of the above chart—trending downward.
Looking at all this, in the short term, bearish sentiment in the U.S. dollar market could be building up and the greenback could be setting up to disappoint investors.
Long-Term Chart Shows Dire Outlook for the Dollar
But, let’s back this chart up a bit.
Look at the monthly U.S. dollar index chart below and pay close attention to the blue line on the chart. It represents the 50-month moving average of the U.S. dollar.
This moving average has acted as a great indicator of where the U.S. dollar could be headed for the next few years.
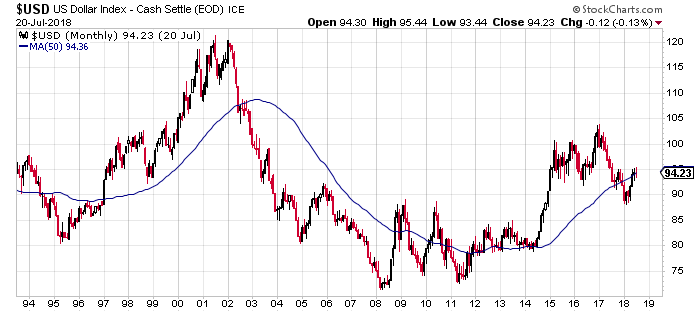
Chart courtesy of StockCharts.com
When the dollar index increases above its 50-month moving average, the U.S. dollar soars.
In early 2012, the U.S. dollar index popped above the moving average and we saw the dollar soar. In late 2017, the index broke below its 50-month moving average and we saw the dollar decline for a few months.
The dollar index is testing the moving average again, but it has been failing to break above that level. This is something to watch closely. If the index fails to break above the moving average, we could see sellers come in and the U.S. dollar drop. On the downside, there isn’t much support until the 80.00 level.
Odds Are Not in Favor of Dollar Bulls
Dear reader, while the charts are making a strong case for the downside on the greenback, you have to remember that the fundamentals aren’t much in favor of the dollar either.
The U.S. government’s debt is soaring, the U.S. economy isn’t doing as well as it may seem, and inflation is surging. These developments are not good for the U.S. dollar.
Also, President Donald Trump has been talking in favor of a lower U.S. dollar. Last week he criticized the high dollar, but that wasn’t the first time he did that. This matters a lot; it could spook those who hold the dollar.
Imagine you own shares of Amazon.com, Inc. (NASDAQ:AMZN), and Jeff Bezos (the CEO), says “I don’t like the valuation of AMZN stock.” What would you do? Probably think twice about your position.
With all this in mind, the outlook for the U.S. dollar doesn’t look bright.
If the dollar drops, gold could be worth watching closely. It’s trading at rock-bottom prices already. A lower dollar could make gold an even more compelling opportunity.